Event and Causal Factor (ECF) charts provide a graphical means of representing the sequence of events leading to a failure. These charts should track in logical progression from the beginning of the initiation-preaccident-accident-amelioration sequence to the end.
Symbols and Definitions used in the ECF Diagram

- Primary Chain (symbol: straight horizontal line with events joined by bold connecting arrows): The primary flow of events begins with the adverse (or near miss) event. Subsequent analysis extends the scope of events to consider decisions that were made prior to this event; however, such information may not be immediately available after the incident. Events or happenings directly leading up to or following the undesirable event are 'primary events' and are depicted on the primary event line connected to each other by solid arrows.
- Secondary Chain (symbol: horizontal lines at different levels above or below the primary sequence): Actions or happenings that impacted on the primary event but were not directly involved in the undesired event are 'secondary events' and may consist of event sequences, contributing factors, or systemic factors.
Constructing the chart should begin immediately as part of the primary investigation. However, the initial chart will only be a skeleton of the final product. Many events and conditions will be discovered in a short amount of time, and therefore, the chart should be updated almost daily throughout the secondary investigative data collection phase. Keeping the chart up to date helps ensure that the investigation proceeds smoothly, that gaps in information are identified, and that the investigators have a clear representation of the accident chronology for use in evidence collection and witness interviewing.
Begin by mapping out a chronology of events. Time is assumed to flow from the left of the diagram to the right. The approach is similar to the use of timelines, but ECF charts must distinguish a primary chain of events from other sequences of events that contribute to the failure.
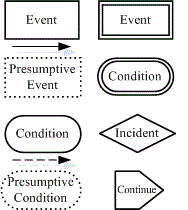
Incident: The adverse outcome being investigated (symbol: diamond) is drawn to the right of the ECF timeline. This symbol can also be used for 'near miss' incidents with a potential adverse outcome.
Events: Events represent actions (symbol: rectangle) e.g. 'pipe wall ruptured' and not 'the pipe wall had a crack in it'. Events should:
- be stated with one noun and one active verb eg "the patient fell". "the doctor wrote an order",
- be atomic statements (only have one action) eg "the doctor wrote the order in the chart
and told the nurse over the telephone when to give the medication" {two events in the one sentence, each of which must be assessed separately for possibility of error}. - be quantified as much as possible and whenever applicable (e.g. "the patient fell from the wheel-chair head-first on to the cement footpath" "the doctor wrote an order for 50mg of pethidine intramuscularly in the stat section of the order sheet").
- document times and dates
- be derived from the events that precede them.
- failures due to OMISSION of some action are represented as negative events (non-events) e.g. "nurse did not perform patient identification before giving the medication"
Condition (symbol: oval/ellipse): Describe (i) states or circumstances rather than happenings or occurrences, and (ii) are passive rather than active (iii) use quantitative descriptions to characterize conditions, and include the timing and duration of the condition when known. They indicate circumstances that may have influenced the course of events and provide additional details such as temperature, pressure, status etc. For example, 'the weather was bad' or 'workers were tired'. They should be associated with the particular events that they help to influence. Conditions are connected to each other or to events by arrows with dashed lines.
Arrows:
- solid arrows are used to connect events
- dashed arrows are used to connect conditions to events
- double-headed arrows are used to indicate mutually exclusive condition and incident

Using the outline of a symbol to indicate the Level of Evidence
Confirmation (solid lines defining the symbol shape): Events or conditions known to have taken place (events) or to have existed (conditions) as proven by documentation or other objective evidence are indicated by unbroken lines outlining the shape (event rectangle, condition ellipse).
Presumption (dotted lines defining the symbol shape): Events or conditions that are assumed to have happened or existed because it appears logical from the sequence of events (but proof is lacking) are indicated by dotted lines for the event rectangle (presumptive event) and the condition ellipse (presumptive condition). There is no means of being completely sure that this did occur, and investigators must develop additional ECF charts (in which these presumptive events/conditions did NOT take place). When an investigation reveals two or more problems (multiple independent failures) that might have led to an incident, this is indicated by ECF charts with different chains of events and conditions that lead to the same incident symbol.
Inadequate/Incorrect (symbol double lines): Less Than Adequate (LTA) performance or the potential for incorrect assumptions is shown as double lines around the symbol for event or condition, whichever is appropriate. These conditions provide an important starting point for any subsequent attempts to distinguish root causes from contributory factors.
Continuation (symbol: wedge) Complete analysis results in many ECF diagrams, as each problem area gets expanded analysis. How these diagrams related to each other is shown by a wedge (rectangle at one side, triangle on the other) with the details of the link written within it.
Causal Factor Analysis: Causal factors are such things as human error or equipment failure, and they commonly include the following:
- The initiating event for an accident
- Each failed safeguard
- Each reasonable safeguard that was not provided
- Contextual Factor: events or conditions that did not directly contribute to the incident (symbol: ordinary event rectangle). The incident might still have occurred even if this event had not taken place.
- Contributory Factor: events or conditions that collectively increase the likelihood of an accident but that individually would not lead to an adverse occurrence.
- Root Cause: meet the definition of causation by counterfactual reasoning: that is, if a root cause had not occurred, then the incident would not have occurred.
- Exacerbating Factor: do not contribute to the likelihood of the adverse event but they can increase the consequences.
Limitations of Event and Causal Factor Charting
Although event charting is an effective tool for understanding the sequence of contributing events that lead to an accident, it does have two primary limitations:
- Will not necessarily yield root causes. Event charting is effective for identifying causal factors. However, it does not necessarily ensure that the root causes have been identified, unless the causal factor is the root cause.
- Overkill for simple problems. Using event charting can overwork simple problems. A two-event accident probably does not require an extensive investigation of secondary events and conditions.
Development of the ECF Diagram
- Select the accident. Define the accident of interest. If there is more than one accident, choose the last one to occur.
- Define the primary sequence of events leading to the accident. Outline the thumbnail sketch of the sequence of events leading to the accident. Work backward from the accident, making certain that each subsequent event is the one that most directly leads to the previous event.
- Complete the model by adding secondary events and conditions. Add secondary events and conditions as appropriate to ensure that all events and conditions leading to an accident are sufficient and necessary to cause the accident. Add events as appropriate to display the contributors to the secondary events and conditions.
- Identify causal factors and items of note. Designate the underlying contributors to the accident as causal factors. Document any items of note.
As the results from other analytical techniques (barrier analysis, change analysis) are completed, they are incorporated into the ECF chart. The ECF chart is used to show when an event occurred. Time is assumed to flow from the left of the diagram to the right. Identify the causes of the incident, beginning with the event that immediately precedes the incident. Ask "would the incident have occurred without this event?" If the answer is yes (ie the incident could have occurred without this failure), then the event can be classified as CONTEXTUAL detail. If however, omitting this event from the ECF chart would result in no coherent explanation of the failure, then this event is a CONTRIBUTORY factor, and further analysis should be conducted.
- Acts of Commission: identify those events that occurred. Evaluate whether they were inappropriate, or essential to the development of the undesirable event (primary effects)
- Acts of Omission: identify events that should have occurred but did not. This is much more difficult, but some investigators report that up to 80% of problems arise from this category.
- Why? for each condition identified, determine why that condition existed. Treat the condition as an effect and determine the cause for the effect. Identify conditions at the outset of the event, during the course of the event, and following the course of the event.
Barrier analysis starts from the assumption that a hazard comes into contact with a target because barriers or controls were unused or inadequate. Three different forms of barriers (people, process and technology) and six failure modes are discussed further in the section on Barrier Analysis. The results of barrier analysis of physical and/or administrative deficencies relate to distal factors and help to identify additional events that ought to be introduced into the ECF diagram. This is particularly important because primary investigations often focus on catalytic events rather than events that weakened particular barriers. You should learn how to analyze problems such as lack of staff, changes in management, inadequate training skills, poor communication, lack of oversight etc. and show them graphically on the ECF diagram.
Change analysis provides a good means of identifying wider contextual issues that can often be overlooked. It helps to focus on the impact of managerial and organizational strategy. The middle column, present condition, in the change analysis table can be directly introduced as a condition within an ECF chart. However, change analysis does not identify which events this present condition will affect, and often an event node needs to be added. The introduction of new information can force revisions to previous versions of the ECF diagram. These revisions may result in conditions or events being removed, merged, edited, or moved.
Specific vs Generic: During the analysis of an adverse event, it is important to remember that the goal is to prevent it happening again if possible (or minimize the consequences if it does recur). Events and conditions specific to one occurrence will hinder investigation of generic system problems. Therefore, at this stage, consider redrawing the ECF chart (without date-time items) and decide for each individual event/condition whether it was specific to the one occurrence (in which case omit it from the revised ECF chart), or whether it was possible to be a factor in multiple cases. This should help to clarify the important issues that need to be focused on and resolved.

ECF charts, typically, stretch over many pages. This can separate key events during the analysis and testing of a system from the point at which it is presumed to fail; however, it helps to trace the impact that distal events and conditions have upon catalytic failures. This is a significant benefit for complex, technological incidents. At a relatively high level of abstraction, an ECF chart may extend to well over fifty event nodes; many investigations produce ECF charts that contain over one thousand events and conditions.