
|
= "x-bar" arithmetic mean (average) |

|
= "x-double-bar" grand mean (average of all the averages) |
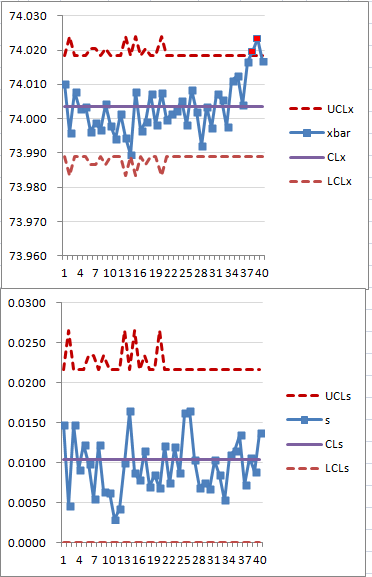
The Xbar and s chart is a pair of independent control charts, one on the averages of each subgroup (xbar values) and one on the spread (standard deviation) between the measurements within each subgroup. These two variables are usually plotted over time. The chart centerlines are x-double-bar and s-bar.
Data are from observations that have been aggregated into subgroups that are as homogeneous as possible (elements within the subgroup are as much alike as possible). A subgroup is a set of measurements that are obtained under similar conditions or during the same time period. The subgroup size may vary, and can be as low as 2 or 3. Subgroups can also be very large, as in administration databases.
For charts with varying subgroup sizes, the control limits step up and down, being wider for the smaller subgroups. There will also be a step in the centerline for the s chart, wherever there is a change in subgroup size.
Factors for Variables control charts
The factors {A3}, {B3}, and {B4} (which depend on the subgroup size) are tabulated in Table 2. For people using Excel, the hand-coded tables can be read using the LOOKUP function, or the Excel functions in Table 1 can be used to dynamically calculate the values based on the subgroup size. The factor {C4} is often written with the subscript n to emphasize that it changes with each subgroup size n, where n ≥2.
Interpretation
For process improvement when using time-ordered data, the same tests as for other control charts are used for the x-bar chart. However, only test #1 (one or more points outside the 3 standard deviation limits) is used. The average chart (the chart on the top) indicates how the process varies between samples. The "s" chart (found below it) show the amount of variability within the samples.
When analyzing these charts, the s chart should be analyzed first. If it has one or more points exceeding a control limit, you should not analyze the average chart.This is because the average of the standard deviations is used to compute the limits for the xbar chart. If the s chart is out of control, then the UCL and LCL of the average chart will be biased.Also note that the s chart does not have zones, becasue zones are not appropriate for it.
For process control, only test #1 is used for both the x-bar and the s charts.
So what to do with this chart now that it is constructed? You know several things:
- the process is in control
- on the average, it takes about CL time to perform the process in future unless
- something happens that signals a special cause
- action is taken to intervene and process improvement is initiated
- use this data to give feedback to users of the process, in particular, if they are complaining about how "long it takes" or how variable it all is. If they decide that the current process average is not acceptable, then the basic option is: take action to improve the process!
If you decide to take action to improve a common-cause (stable) process, you will know you have been successful in improving the process if:
- the variability in the process is reduced (that is, the distance between UCL and LCL is reduced)
- and/or the process average moves above/below its previous level.
In order to test the impact of your intervention, you would "freeze" the control limits and process average where they are and continue to plot new data against these values. If your intervention strategy works, you will see a reduction in the variability and/or a shift in the process.
How to draw an Xbar and S chart with unequal subgroup sizes

Phase 1: deriving factors A3, B3, B4
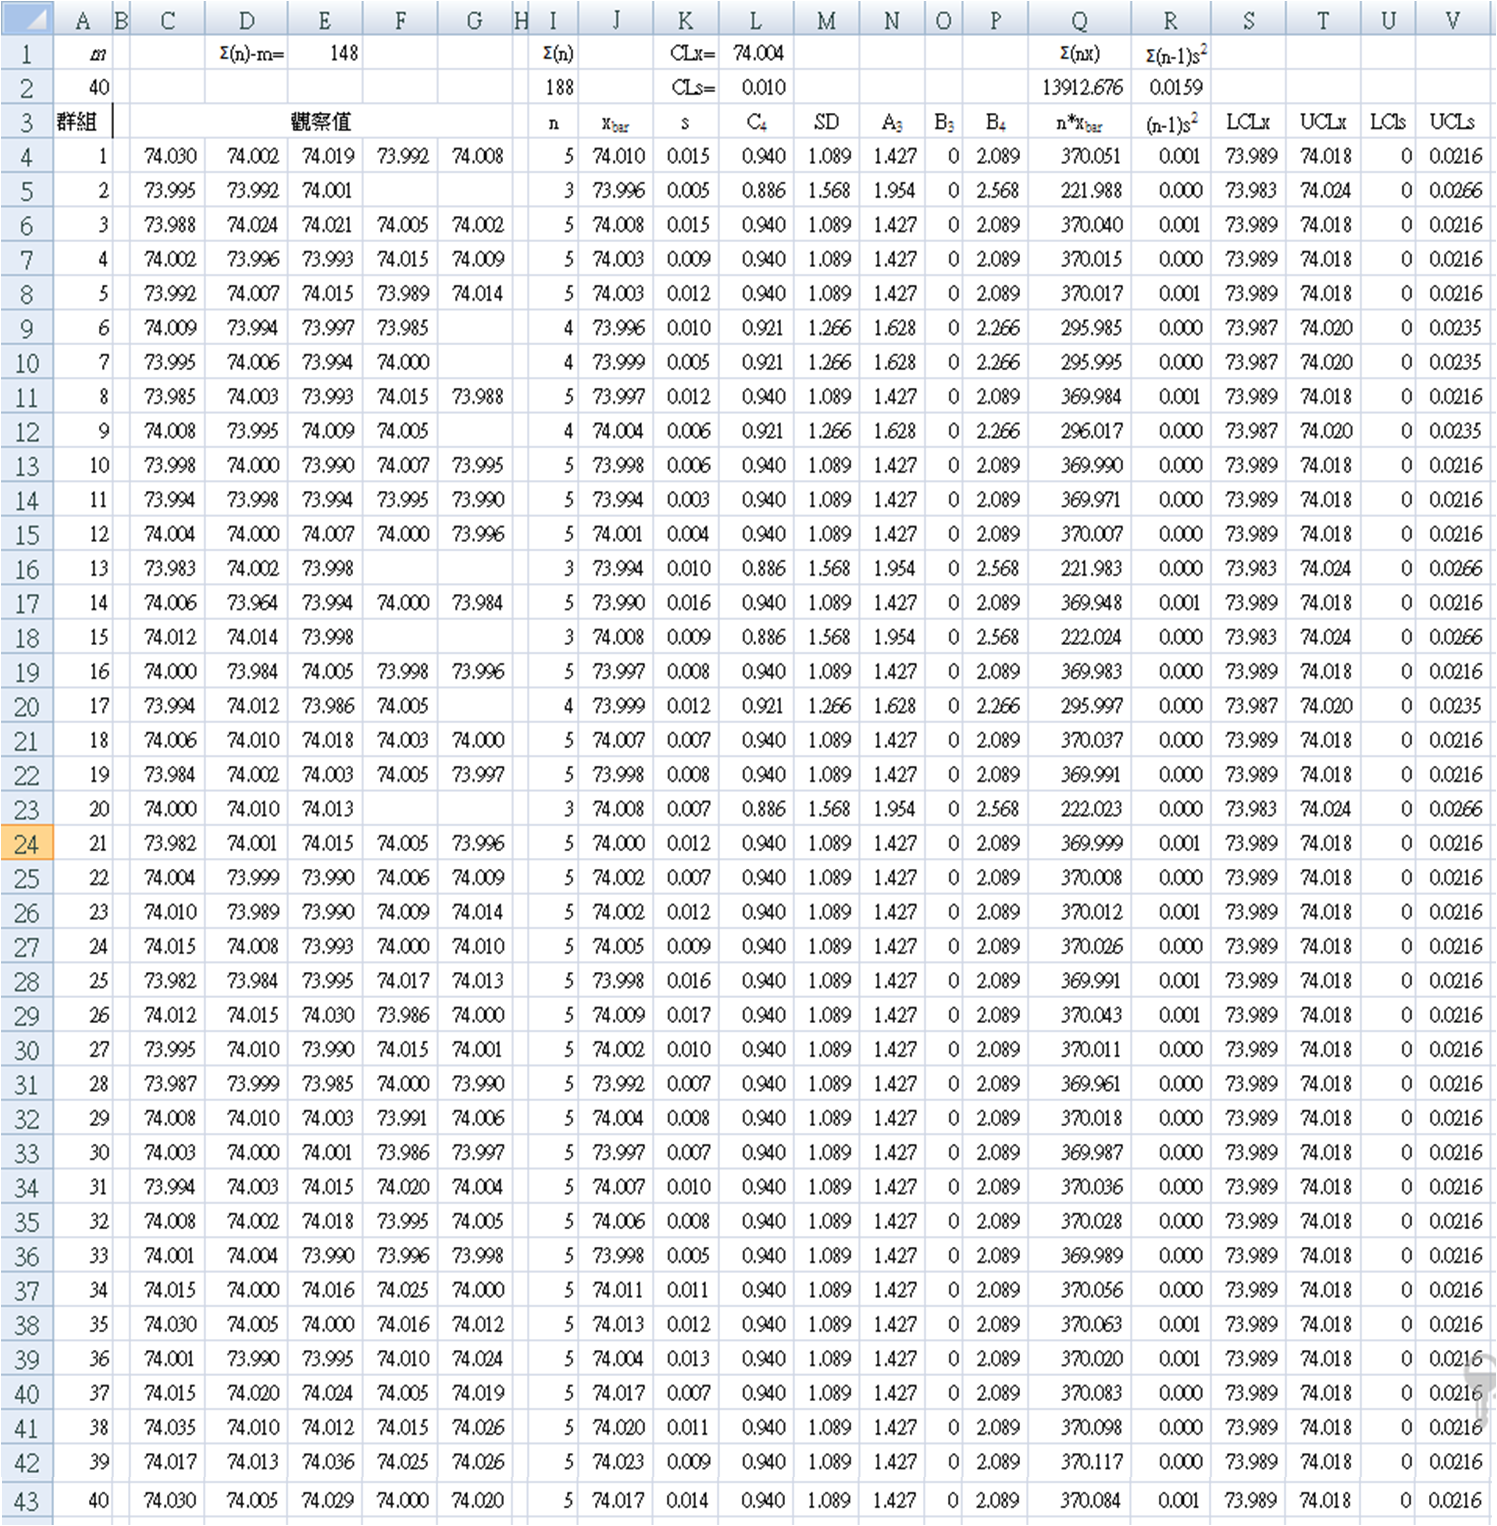
- For each row, use Excel functions to count (ni) the number in the subgroup, calculate subgroup average (xi), and calculate the standard deviation (si).
Store ni in cell Hi as "=COUNT(Ci : Gi)"
→ I4 = COUNT(C4 : G4) => 5
Store xbari in cell Ii as "=AVERAGE(Ci : Gi)"
→ J4 = AVERAGE(C4 : G4) => 74.010
Store si in cell Ji as "=STDEV(Ci : Gi )"
→ K4 = STDEV(C4 : G4) => 0.015
Confirm that the formulae are entered correctly: for example, for the first subgroup, the example onscreen should result in n1 => 5, xbar1 => 74.010, s1 => 0.015 - In the next column (L4), insert the formula for calculating factor {C4} for this subgroup:
= EXP(GAMMALN(Ii / 2)) * SQRT(2 / (Ii - 1)) / EXP(GAMMALN((Ii - 1) / 2))
Confirm that the formula for subgroup 1 results in C4(n=5) => 0.940.
= EXP(GAMMALN(I4 / 2)) * SQRT(2 / (I4 - 1)) / EXP(GAMMALN((I4 - 1) / 2)) - Next, in order to simplify the calculations, put the standard deviation derived from C4 into an adjacent cell (M4):
= 3 * SQRT(1 - POWER(Li , 2)) / Li
→ M4 = 3 * SQRT(1 - POWER(L4, 2)) / L4 => 1.089 - Now, in the next three cells to the right (N, O, P), use the equations to calculate A3, B3, and B4.
{A3} in Ni = 3 / (Li * SQRT(Ii))
→N4 = 3 / (L4 * SQRT(I4)) => 1.427 (for subgroup 1)
{B3} in Oi = IF((1 - Mi) < 0, 0, (1 - Mi))
→O4 = IF((1 - M4) < 0, 0, (1 - M4)) = 0 (for subgroup 1)
{B4} in Pi = 1 + Mi
→ P4 = 1 + M4 => 2.089 (for subgroup 1)
Phase 2: calculating CL, UCL, LCL for unequal subgroups
- Calculate [ni * xbari] and [ni - 1) * si2] for each row.
(a) in column Qi calculate ni * xbari = Gi * Hi
→ Q4 = I4 * J4 => 370.51
(b) in column Ri calculate R (ni - 1) * si2 = (Ii - 1) * POWER(Ki, 2)
→ R4 = (I4 - 1) * POWER(K4, 2) => 0.00087 (≅ 0.001) - Use column A to count and column I to add the subgroups:
(a) total number of subgroups (m) into cell $A$2
m: A2 = COUNT(A4 : An) = COUNT(A4:A43) => 40
(b) total number of items sampled in subgroups into cell $I$2
I2 = SUM(I4 : In) = SUM(I4:I43) => 188
(d) Add column Q into cell $Q$2 Σ[ni * xbari]
→ Q2 = SUM(Q4:Q43) => 13912.676
(e) Add column R into cell $R$2 Σ[ni - 1) * si2]
→ R2 = SUM(R4:R43) => 0.0159 - Calculate weighted average for xbar: → L1 = $Q$2 / $I$2 => 13912.676 / 188 => 74.004

- Calculate weighted average for s: → [Σ(ni) - m] : E1 = I2-A2 => 188 - 40 => 148

→ L2 = POWER($R$2/$E$1, 0.5) = POWER(0.0159 / 148, 0.5) = 0.010 - Calculate centerline and control limits for each subgroup of the x graph:
CLx (x-double-bar) = L1 = 74.004
LCL(n=i) , UCL(n=i) = CLx ± A3(n=i) * CLs
LCL(n=1): S4 = $L$1 - N4 * $L$2
→ S4 = 74.004 - 1.427 * 0.010 => 73.989
UCL(n=1): T4 = $L$1 + N4 * $L$2
→ T4 = 74.004 + 1.427 * 0.010 => 74.018 - Centerline and control limits for each subgroup of the s graph:
CLs (s-bar) = $L$2
LCL(n=i) = B3(n=i) * CLs
UCL(n=i) = B4(n=i) * CLs
LCLs = Oi * CLs
→ U4 = O4 * $L$2 = 0 * 0.010 = 0
UCLs = Pi * CLs
→ V4 = P4 * $L$2 = 2.089 * 0.010 = 0.021 - Use Excel to draw the two control charts as in Figure 1 above.
| Equation | Excel |
|---|---|
 |
This uses the gamma function of n (Γn).
Using an Excel Worksheet as an example, with the data for each subgroup in one line, so that A1…F1… or beyond is the first subgroup, A2…F2… is the second subgroup and so on. Taking the first subgroup as an example, the subgroup number n in Excel cell: A1 calculate {C4} for this subgroup as follows: In Excel version 2003, can use the exponential of gammaln factor {C4}(n=i) = EXP(GAMMALN(A1 / 2)) * SQRT(2 / (A1 - 1)) / EXP(GAMMALN((A1 - 1) / 2)) From Excel version 2013 onwards, can directly call the gamma function, where GAMMA(x) = Γ(x). factor {C4}(n=i) = GAMMA(A1 / 2) * SQRT(2 / (A1 - 1)) / GAMMA((A1 - 1) / 2)) For programmers using the chart control in *.net applications, use Γ(x) = Chart1. DataManipulator. Statistics. GammaFunction (x) |
 |
Continuing on the same line for the subgroup n in Excel cell: A1 and now using the {C4} value just calculated above:
factor {A3} = 3 / ({C4}(n=i) * SQRT(A1)) |
 |
Next, calculate the standard deviation as follows:
{standard-deviation}=3*SQRT(1 - POWER({C4}(n=i), 2)) / {C4} then calculate factor {B3}, using the standard deviation just calculated, and making sure that no results are less than zero. factor {B3} = IF((1 - {standard-deviation}) < 0, 0, (1 - {standard-deviation})) |
 |
Finally, calculate {B4} as follows:
factor {B4} = 1 +{standard-deviation} |
| n | C4 | A3 | B3 | B4 |
|---|---|---|---|---|
| 2 | 0.7979 | 2.659 | 0.000 | 3.267 |
| 3 | 0.8862 | 1.954 | 0.000 | 2.568 |
| 4 | 0.9213 | 1.628 | 0.000 | 2.266 |
| 5 | 0.9400 | 1.427 | 0.000 | 2.089 |
| 6 | 0.9515 | 1.287 | 0.030 | 1.970 |
| 7 | 0.9594 | 1.182 | 0.118 | 1.882 |
| 8 | 0.9650 | 1.099 | 0.185 | 1.815 |
| 9 | 0.9693 | 1.032 | 0.239 | 1.761 |
| 10 | 0.9727 | 0.975 | 0.284 | 1.716 |
| 11 | 0.9754 | 0.927 | 0.321 | 1.679 |
| 12 | 0.9776 | 0.886 | 0.354 | 1.646 |
| 13 | 0.9794 | 0.850 | 0.382 | 1.618 |
| 14 | 0.9810 | 0.817 | 0.406 | 1.594 |
| 15 | 0.9823 | 0.789 | 0.428 | 1.572 |
| 16 | 0.9835 | 0.763 | 0.448 | 1.552 |
| 17 | 0.9845 | 0.739 | 0.466 | 1.534 |
| 18 | 0.9854 | 0.718 | 0.482 | 1.518 |
| 19 | 0.9862 | 0.698 | 0.497 | 1.503 |
| 20 | 0.9869 | 0.680 | 0.510 | 1.490 |
| 21 | 0.9876 | 0.663 | 0.523 | 1.477 |
| 22 | 0.9882 | 0.647 | 0.534 | 1.466 |
| 23 | 0.9887 | 0.633 | 0.545 | 1.455 |
| 24 | 0.9892 | 0.619 | 0.555 | 1.445 |
| 25 | 0.9896 | 0.606 | 0.565 | 1.435 |
| … | … | … | … | … |
| 50 | 0.9949 | 0.426 | 0.696 | 1.304 |
| … | … | … | … | … |
| 100 | 0.9975 | 0.301 | 0.787 | 1.213 |
References
- Montgomery DC. 1997 Introduction to statistical quality control 3rd edition. John Wiley & Sons Inc. New York. [eng.sut.ac.th]
- C4 Function. Computes the expected value of the standard deviation of n independent normal random variables. [v8doc.sas.com]
- Zaiontz C. Gamma function in Excel. [www.real-statistics.com]
- Microsoft Datavisualization Charting. StatisticFormula.GammaFunction Method. [msdn.microsoft.com/library]